ADTD – Active Directory Topology Diagrammer
What ADTD doesLink to this section
ADTD is a Windows console app (C#, .NET Framework 4.8) I wrote more than a decade ago and decided to share. It uses built-in Active Directory APIs (System.DirectoryServices.ActiveDirectory) to enumerate forest topology and export it as GraphML (XML).
The output is a graph, not a fixed diagram, so the same export can be reused in different tooling later (HTML visualisation, analysis scripts, or graph databases such as Neo4j).
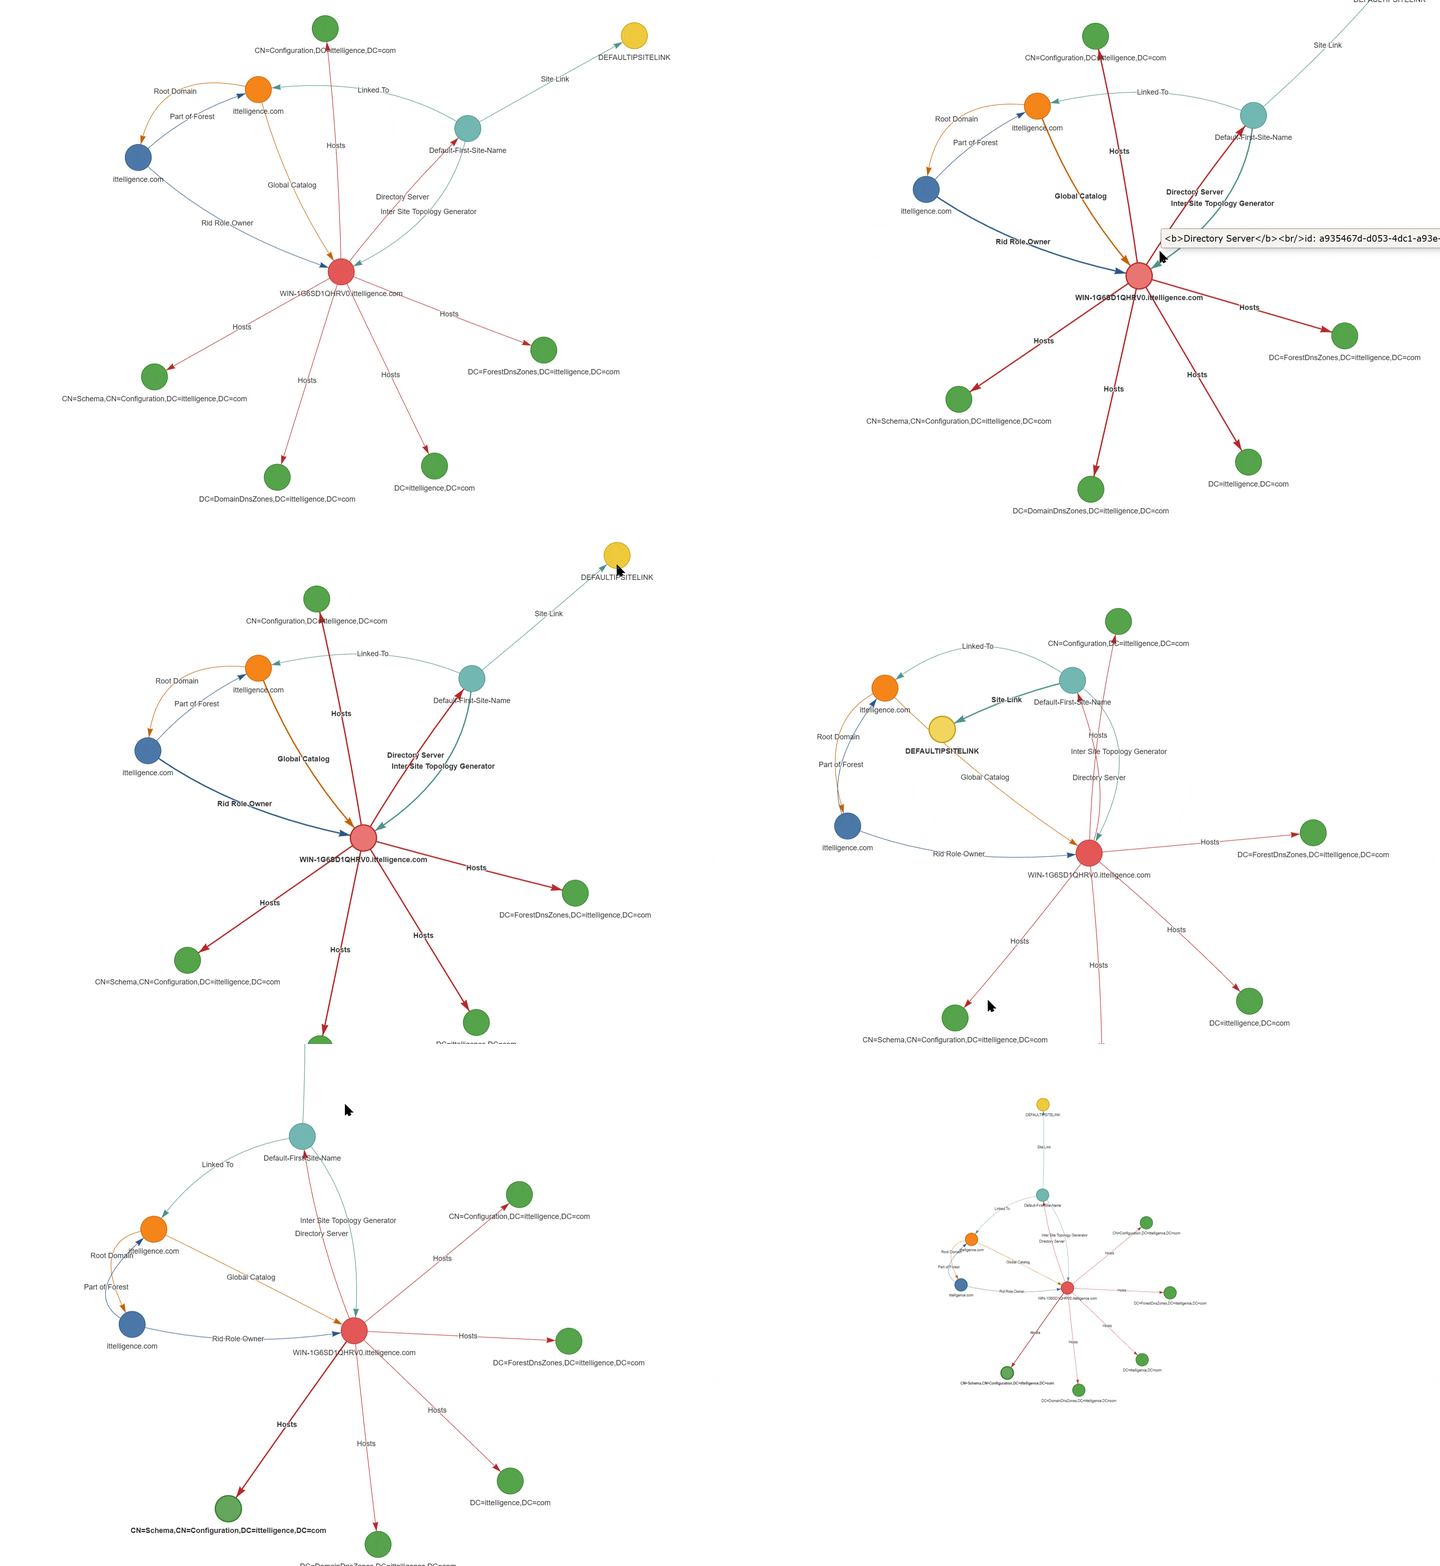
https://github.com/svermaak/ADTD

What gets exportedLink to this section
The GraphML contains nodes for key topology objects and edges for the relationships between them.
Common node types
- Forest
- Domain
- Site
- Subnet
- SiteLink
- Server
- Partition
- Replication connection
Common relationships
- Site link connections (including cost)
- Server membership in sites
- Role owners (FSMO)
- Global catalog
- Replication connection directionality (inbound, outbound)
Labels and attributes are easy to extend because the export model is intentionally simple.
Why GraphML is a good fit for AD topologyLink to this section
GraphML is a widely supported interchange format for graphs, which avoids locking you into one viewer or one vendor. Once topology is represented as a graph you can:
- Visualise it in different tools (interactive HTML, Gephi, yEd, Neo4j tooling)
- Spot oddities (isolated sites, unexpectedly expensive links, missing subnets)
- Compare exports over time (before and after change windows)
- Keep snapshots as evidence for audits or post-incident reviews
RequirementsLink to this section
Exporter (C#)
- Windows
- .NET Framework 4.8
- Network and DNS reachability to domain controllers in the target forest
- An account that can read AD topology (typically true for standard users, hardened environments may restrict some data)
Visualiser (Python)
- Python 3.9+ recommended
- Packages: networkx, pyvis
- Install: pip install networkx pyvis
Quick startLink to this section
1) CloneLink to this section
git clone https://github.com/svermaak/ADTD.git2) Build the exporterLink to this section
Open ADTD.sln in Visual Studio and build (Debug or Release), or run:
msbuild ADTD.sln /p:Configuration=Release3) Export GraphMLLink to this section
Run the compiled executable on a machine that can reach your AD forest:
ADTD.exeIt writes a timestamped GraphML file to the current working directory, for example:
ADTD_20260207_231818.xml
4) Generate an interactive HTML graphLink to this section
ADTD includes makeGraph.py, which converts the GraphML into an interactive HTML page using PyVis (vis-network):
python makeGraph.py --in ADTD_20260207_231818.xml --out graph.htmlOpen graph.html in your browser.
Real world use casesLink to this section
- Explain "how AD is wired" to new staff with a current, clickable graph instead of a stale Visio.
- Validate site link intent quickly (costs, multiple paths, unexpected routes).
- Capture before and after snapshots around change windows for baselines and troubleshooting.
- Produce audit artefacts (store securely, or sanitise names before sharing).
TroubleshootingLink to this section
"The specified domain either does not exist or could not be contacted"
Confirm DNS resolution and reachability to DCs (routing, firewall), connect VPN if needed, or run from a domain-joined machine in the environment.
Empty or incomplete output
Permissions may block reads of some configuration and topology objects in hardened environments, try an account with appropriate read access.
The HTML viewer looks chaotic
Large forests can look noisy with physics layouts. In the PyVis config panel, reduce physics strength, increase stabilisation iterations, try a different layout, or temporarily hide less relevant edge types.
Security noteLink to this section
Topology exports include infrastructure names and relationships. Treat them as sensitive, store them in restricted locations, and sanitise before sharing outside your organisation.
No comments yet
Comments are moderated and appear once approved.